Error Bars & Confidence Intervals For Your Marketing Funnel
After reading this article, you'll understand why you should use the Exact Binomial Test (EBT) to estimate error bars and confidence intervals for marketing funnel questions. Use the tool here to calculate lower bounds, or, visit this python notebook to adapt the python code for yourself.
We all know that we can't infer that a small sample will extend out to a larger sample. So if we only have, for example, only 10 website visitors and 3 convert to a trial... for a 30% conversion rate... we can't expect that 30% to hold if we get 1000 visitors.
The Confidence Interval aka Error Bars
The usual way to get around this is to use a confidence interval. Maybe we can claim that we are 95%
confident that the range is 28% to 32%. Problem solved. We've found a mathematically
grounded way to weasel out of giving a firm number providing a statistically grounded range.
How you probably learned to calculate confidence intervals, and why it's wrong
You might be tempted to whip out the old confidence interval formula from the central limit theorem (CLT):
\( \text{stderr} = \sqrt{\frac{p(1-p)}{n}} \).
While that equation is accurate... it's only accurate when there are a " sufficient" number of samples. The weakness of the CLT is that it doesn't define "sufficient" .
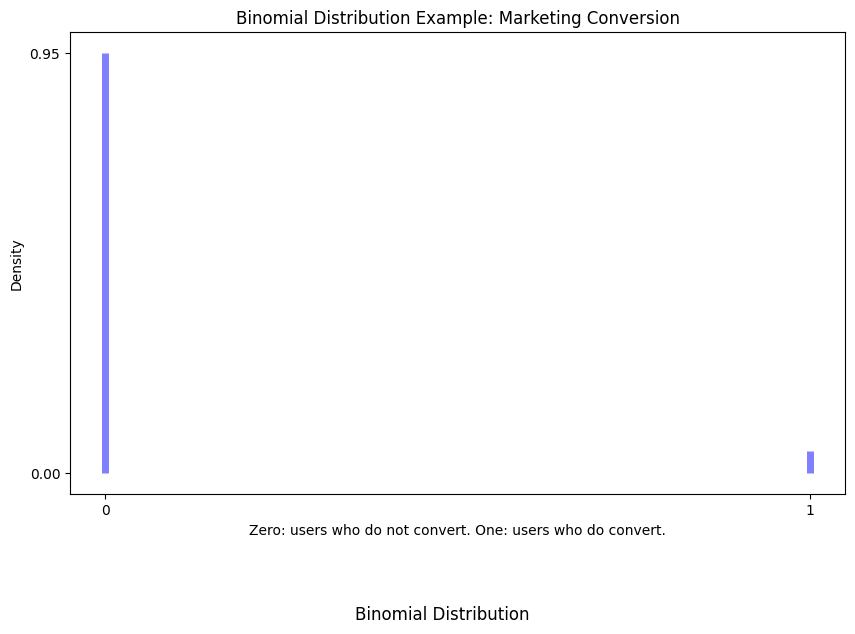
The key is that a marketing funnel's outcome are nothing close to normally distributed. The data isn't spread into a smooth pile of values... they are all at two infinitely skinny peaks. It's also known as a binomial distribution. This gives us a clue... the right way to calculate error bars is not the CLT. Instead, you should use the Exact Binomial Test (EBT). Typically, we use the test to determine if the conversion rate is statistically significant. But we can turn it around and search for different value of conversion rates until we find exactly lower bound that is statistically significant at your desired level of signifiance, typically something like 90%, 95%, or 99%.
Example
Lets set up a problem and run the numbers.
If we use CLT, we'd calculate standard deviation using the formula: $$ \text{std_dev} = \sqrt{p \cdot (1 - p)} $$ $$ \text{std_dev} = \sqrt{0.01 \cdot (1 - 0.01)} $$ $$ \text{std_dev} = 0.099 $$ $$ \text{std_dev} = 9.9\% $$ Then we use the equation for standard error: $$ SE = \frac{SD}{\sqrt{n}} $$ $$ SE = \frac{0.099}{\sqrt{100}} $$ $$ SE = 0.0099 $$ $$ SE = 0.99\% $$ We lookup the z-score for the bottom 5th percentile, which is roughly -1.64. We multiply that by the standard error and get -1.63% as the distance from the mean for 10th percentile value. We add in the mean and get -0.63% as our 95% confident lower bound.
Wait what??? -0.63% as the lower bound? That's impossible.
How can we have a negative conversion rate? We can't. And that is the first clue that the central limit theorem (CLT), with it's assumption that possible values can range from negative infinity to positive infinity, is inappropriate for our marketing conversion problem, where the range of values is bounded by 0% (no one converts) and 100% (everyone converts).
A superior distribution to use, which matches marketing conversions better, is the binomial distribution. We can use a variation of the Exact Binomial Test to measure the lower bound of the actual conversion rate, within some confidence range like 90%, 95%, or 99%.
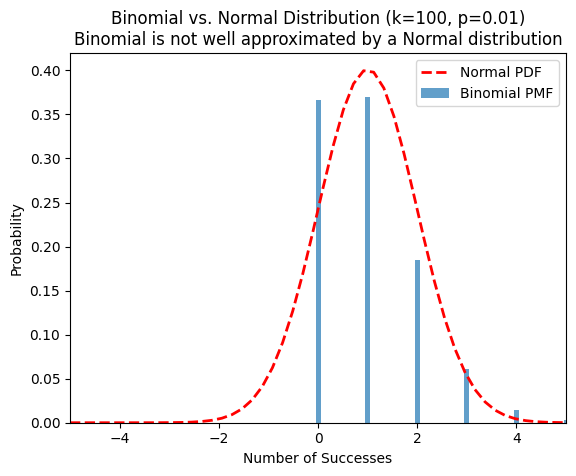
Let's get some intuition by plotting a normal distribution against a binomial distribution. Notice how the binomial distribution is discrete, not continuous. And more mass is closer to zero than the normal distribution. The binomial distribution also never takes negative values, unlike the normal distribution.
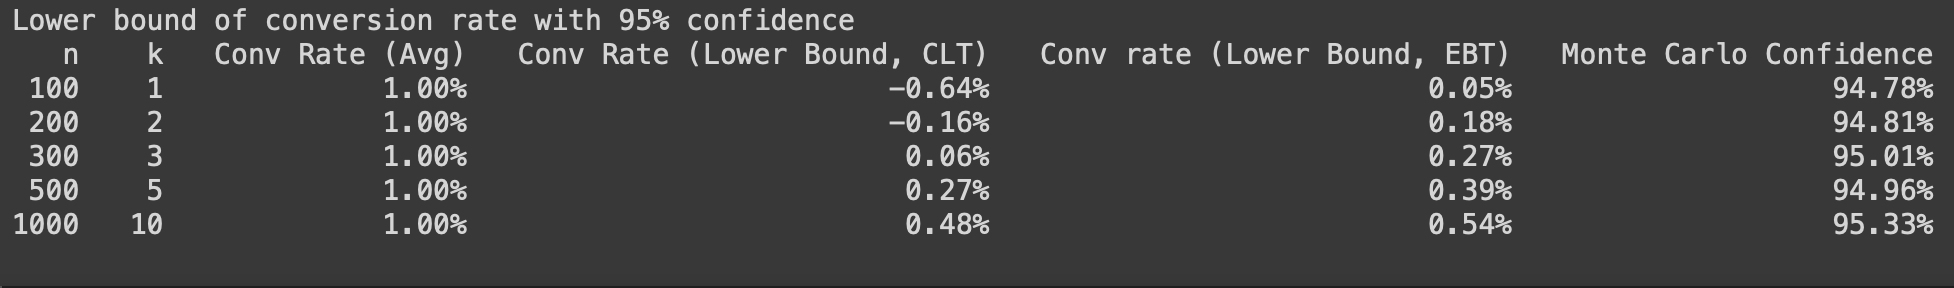
So let's calculate things with the EBT. The math is a little harder to follow than the CLT, but there are plenty of tools to calculate it for you, like mine and this one. Let's look at this table of results so we can compare what the CLT vs the EBT predicts for various sample sizes. The sample size matters a lot to a marketer since there's generally a cost to get a visitor, or trial user, or subscriber. As we can see, the EBT always delivers a positive value, and it's often a higher value than the CLT's lower bound.
The sample size of 300 is probably the most egregious. If we get 3 conversions out of 300, the CLT would predict we can only be 95% confidence that our real conversion rate is above 0.06%. Definitely too low to proceed with more marketing spend. But the EBT predicts 0.27%. Not as good as 1%, but possibly good enough to consider scaling up marketing spend.
The last column is a empirical analysis where we ran a monte carlo simulation 10000 times and empirically calculated how often our estimate of the true conversion rate would deliver at least the number of observed conversiosn. We get 95% across the board - empirical proof that our estimate would be valid 95% of the time.
Conclusion
Congrats! You are now armed with some powerful statistical methods to better estimate the error bars / confidence intervals for your marketing funnel. You may be able to deliver the ultimate high-impact result: a higher confidence estimate of your marketing conversion rate, with less marketing spend! Use the tool here to calculcate lower bounds. For further reading, try the Engineering Statistics Handbook, Published online by the National Institute of Standards and Technology.